To get to a Report, from the Reports List screen:
In List View - Double click anywhere in the row for a report.
In Grid View - Click on the report name.
Each Report can show a collection of Widgets . 
There are a selection of Widgets to choose from, explained in more detail below:
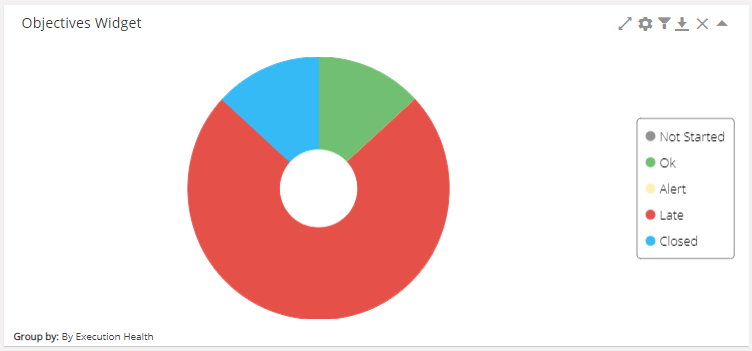
Objectives |
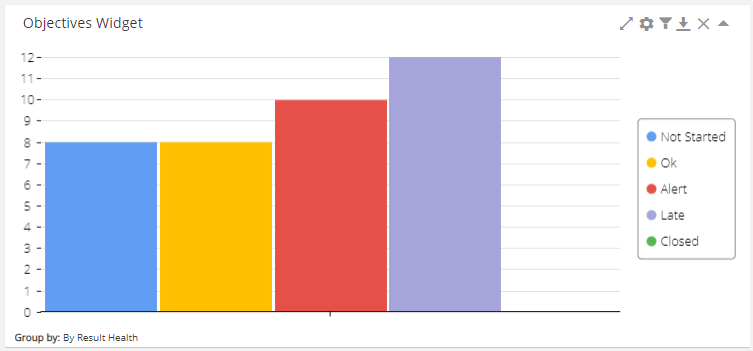
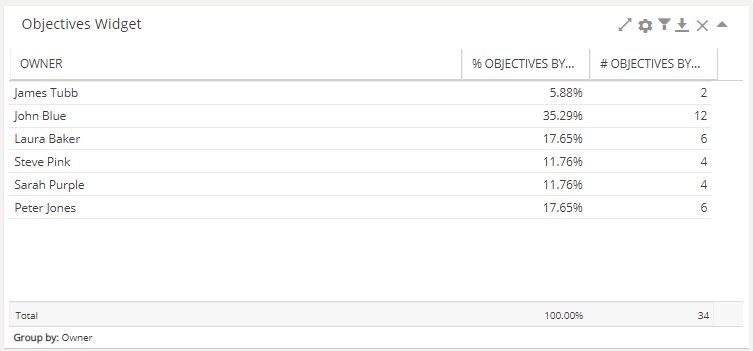
This widget will show a summary of Objectives, grouped by the Execution Health (Progress), the Result Health (KPI Values) or the Owner. The group by option selected will be shown on the bottom left. You can then choose to display the data in one of several ways:
Click in to the widget to see a list of Objectives in this group |
||||||
Tabular View |
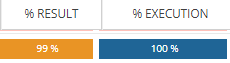
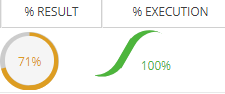
This widget will allow you to display a table showing details of Actions, Initiatives, Objectives, Risks, Issues or Team Members. 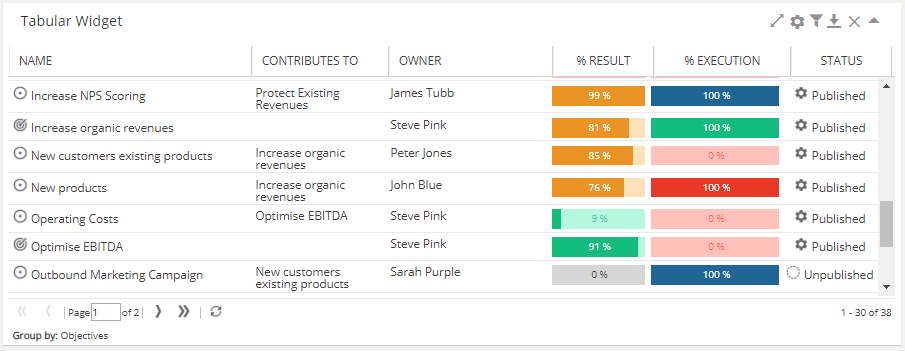 Different filters will be available depending on which item has been selected. The execution and results graphs can be displayed in one of three ways:
|
||||||
Risks |
Use the Risks widget to visualize risks and decide which risks require greater attention by using probability and impact. Risks will be displayed as a bubble diagram: 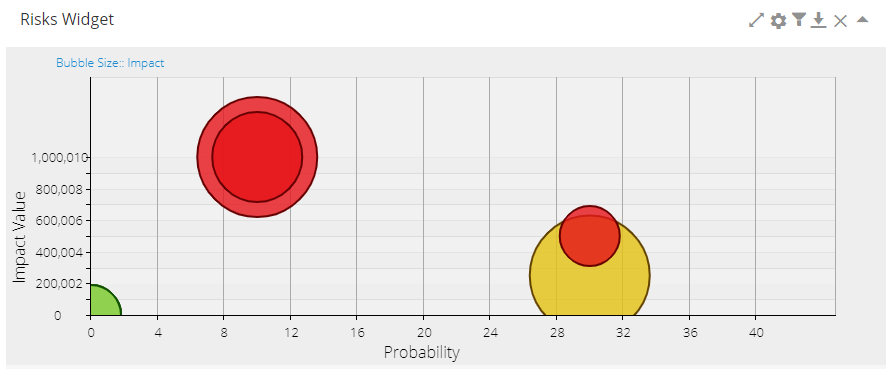 and/or as a matrix: 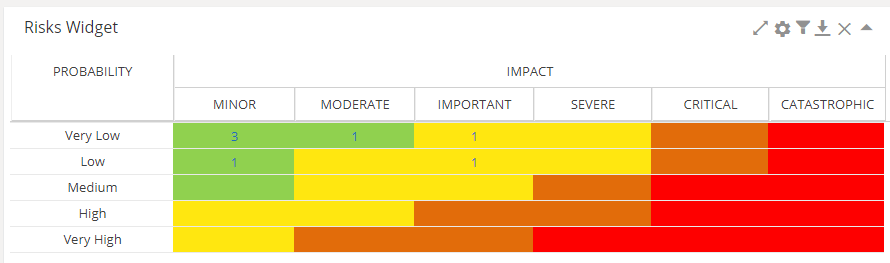 *Note: If the Widget is expanded to show as full screen both the bubble diagram and matrix will be shown which is why even if using the matrix option you still need to configure the bubble diagram x, y, z axis options. |
||||||
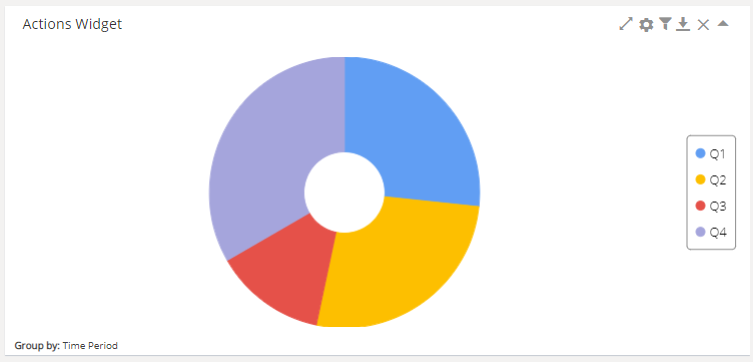
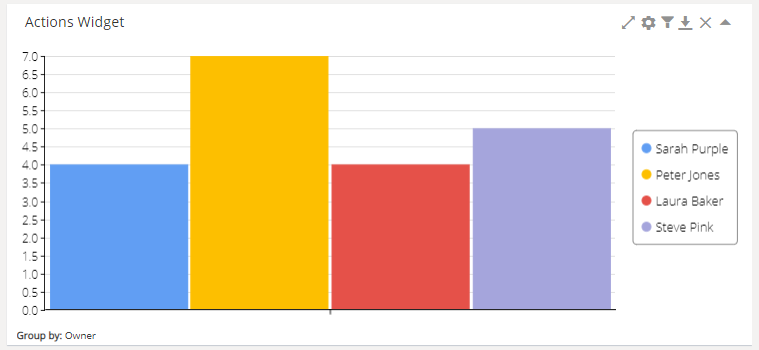
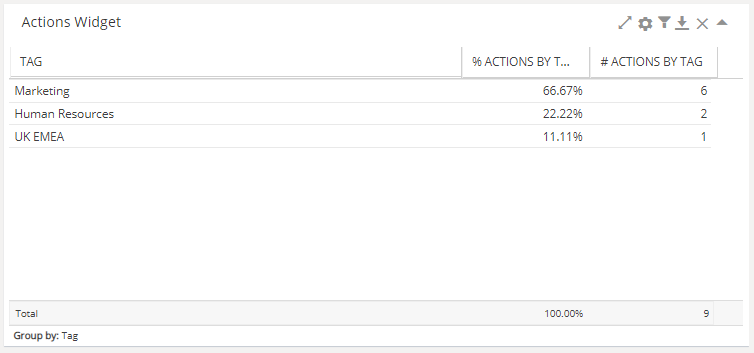
Actions |
This widget will show a summary of Actions, grouped by the Execution Health (Progress), the Owner, Tags or Time Period. The group by option selected will be shown on the bottom left. You can then choose to display the data in one of several ways:
Click in to the widget to see a list of Actions in this group |
||||||
Text |
This widget allows entry of text (with the option to include links, icons or tables) to provide more information to compliment your report. When the widget is first created (or when you use the cog icon) you can set the Widget Name and if other users can edit the text displayed. This widget is always manually updated by a user, no information is populated by Untap. Double click into the widget to edit the text displayed: 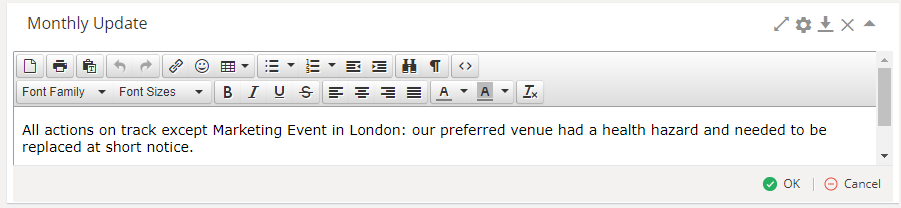 |
||||||
Execution Status |
This widget allows you to show the Execution Status (Progress %) for a specific Action, Objective, Initiative or for the Company (overall progress of all Actions). Note: the results are dependant on the Financial Year selected from the drop down on the top right (Unless you have selected for an Initiative's Overall Execution). 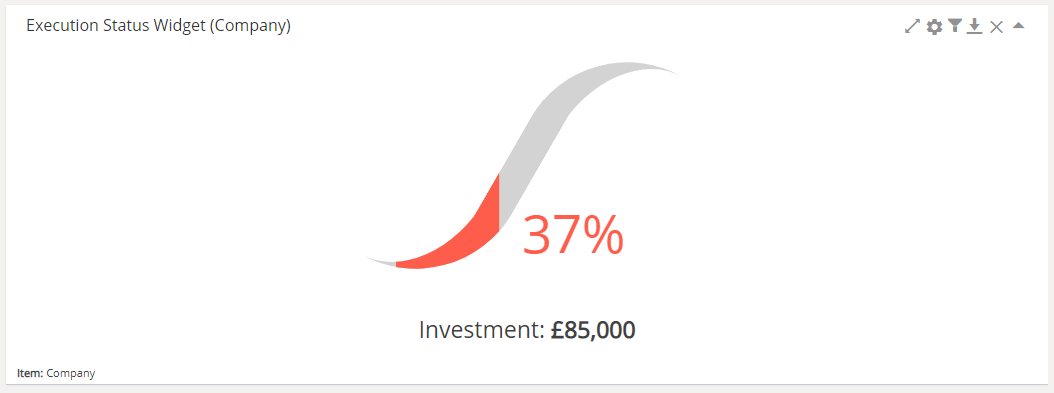 You also have the option to set a drill down, to choose where the user will be directed when they click into the S Curve. This can be the Details, another Report or an external URL. |
||||||
Company Result Status |
This Widget will display the Company Result Status % based on the calculation against the Valuation Formula. 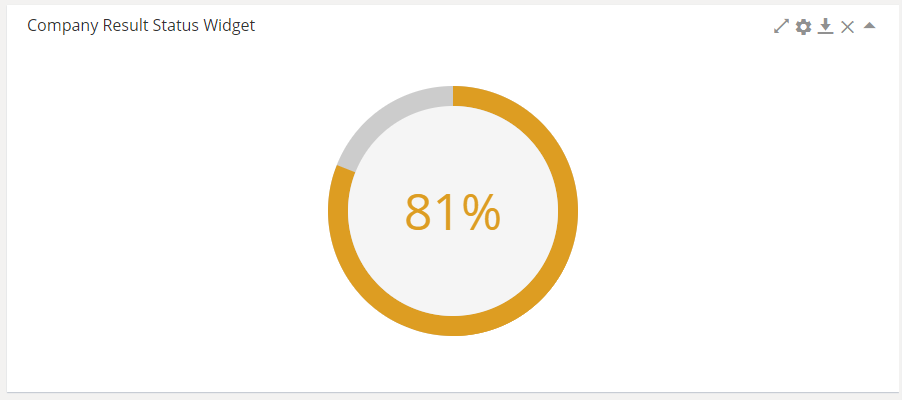 |
||||||
Balance Score Card Dimension |
Use this widget to create a score card showing the Result Status (Performance against KPI Targets) and Execution Status (Progress %) for selected Objectives. Start by selecting Objectives to include in the widget (remember you can create multiple widgets to capture a different set of objectives). 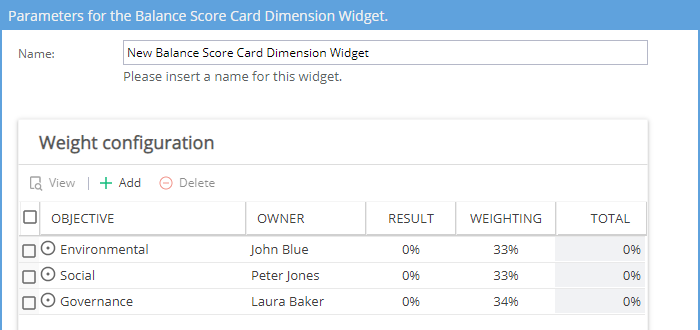 Note: When you first select Objectives, the Result % and Total % will show with 0 values, these fields will be calculated by Untap once you click OK to confirm the Objectives to be used. 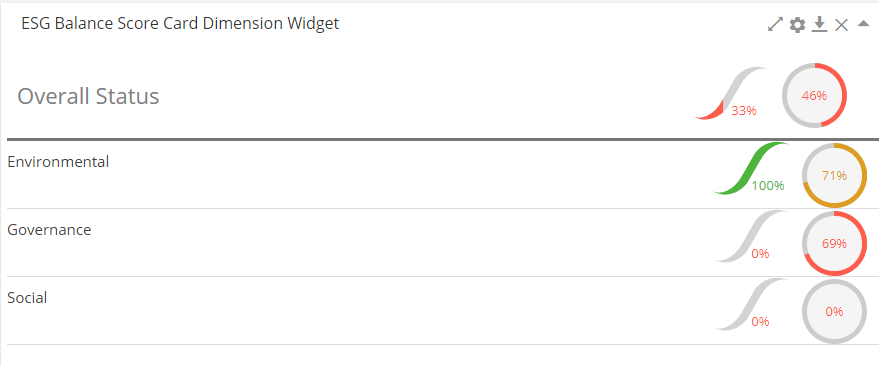 |
||||||
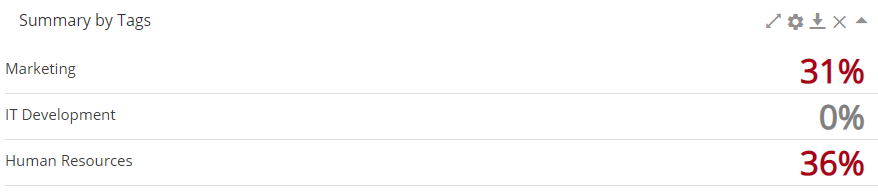
Summary by Tags |
This widget will show a summary of the execution status (progress) |
||||||
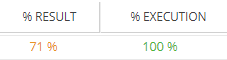
Objective Result |
This Widget will display the Result Status (Performance against the KPI Target) for a chosen single Objective. You can configure this widget to show the Result Status %: 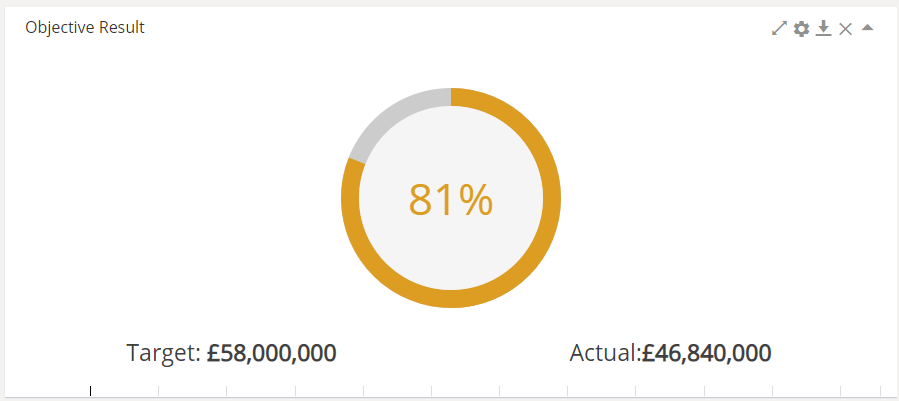 Or set the widget to show a graph of Planned Vs Actual (for YTD or LTM). 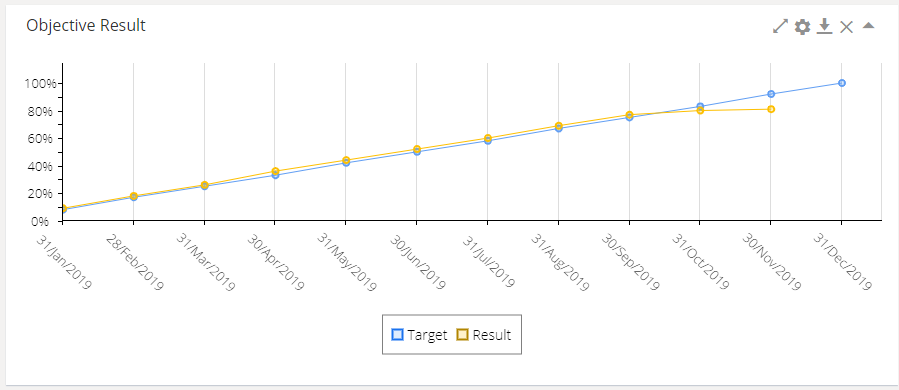 You also have the option to set a drill down, to choose where the user will be directed when they click into the graph. This can be the Objective Details, another Report or an external URL. |
||||||
Value Creation Status |
This widget will show 3 columns:
The Target EV and Current EV can be seen from the Portfolio Summary Screen and the details for the Company Result Status. 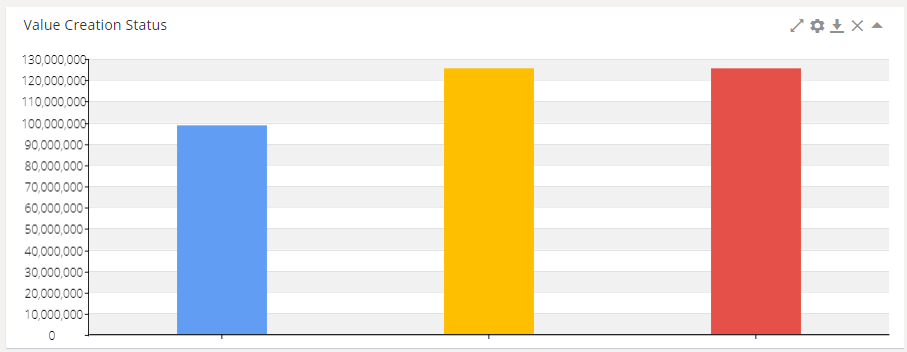 Note: The Target and Planned Values may appear to be the same. This will depend on the measurement options selected in the Valuation Formula. |


Select a widget and click Add Widget (or double click on the widget name).
A pop up window will show with any parameters to configure, then click OK.
The Widget will then be included in your Report.
Remember the data most widgets display will depend on the Financial Year selected.
Each widget will display some icons on the top right:
| Expand |
 |
Maximise the widget to show as full screen |
| Cog |
 |
View the parameters pop up window to change the configuration |
| Filter |
 |
Shows any options to filter by (if applicable) |
| Export |
 |
Export a copy of the widget as PDF, CSV or Excel |
| Collapse |
 |
Show only the blue header bar for the widget |